Ocean Barrier Layers
Overview
The ocean water column is not uniform. Near the surface, wind and buoyancy fluxes mix the water into the mixed layer (MLD), a relatively homogeneous layer in both temperature and density. Below it lies the isothermal layer (ILD), defined by the depth at which temperature begins to drop sharply toward the thermocline. When the density-based mixed layer is shallower than the temperature-based isothermal layer, the layer in between is defined by strong salinity stratification but weak or neutral temperature stratification. This is the barrier layer (BLD = ILD - MLD).
When a barrier layer is present, the surface water becomes physically isolated from the deeper, cooler ocean. It cannot ventilate, it cannot exchange heat downward, and it can warm excessively. Because the salinity-stratified layer is thinner than the temperature-defined isothermal layer, it makes the surface ocean far more reactive to atmospheric forcing.
This project analyzes barrier layer depth globally using CMEMS ocean reanalysis data spanning 1993 to 2024, at two horizontal resolutions (0.25° and 0.083°), comparing six different ILD detection methods to characterize BLD distribution, variability, and long-term trends.
Why it matters
Barrier layers play a critical role in ocean-atmosphere interactions, ocean thermodynamics, and global climate variability.
Energy trapping. When a barrier layer is present, energy transferred from the atmosphere by wind and buoyancy forcing becomes trapped in the upper mixed layer, making the surface ocean far more reactive to atmospheric changes.
Inhibiting surface cooling. Barrier layers act as a physical shield between the warm surface and the cooler thermocline below, preventing heat exchange and inhibiting surface cooling. The warm subsurface reservoir associated with a barrier layer can be eroded by intense atmospheric forcing, releasing heat and generating positive sea surface temperature anomalies.
Influence on major climate phenomena. This process significantly influences the onset of ENSO events, the development of the Indian monsoon, and the Madden-Julian Oscillation. In the Atlantic Warm Pool, barrier layers help modulate tropospheric vertical wind shear and atmospheric moisture stability, directly impacting summer rainfall and Atlantic hurricane activity.
Tropical cyclone intensification. The warm waters insulated by barrier layers provide the heat energy needed for tropical cyclone development and intensification, making their detection and monitoring directly relevant for climate risk applications.
Ocean circulation. In the northwestern tropical Atlantic, barrier layer systems sit on the path of the surface branch of the Atlantic Meridional Overturning Circulation, meaning their formation and seasonality can influence remote oceanic conditions and impact climate across the entire Atlantic basin.
Methodology
BLD is computed from vertical profiles of temperature and salinity from CMEMS global ocean reanalysis at two horizontal resolutions (0.25° and 0.083°), covering 1993 to 2024. The core challenge is that there is no single agreed-upon method to detect the isothermal layer depth. Six methods from two families are implemented and compared:
| Method | Definition |
|---|---|
| Gradient | First depth where dT/dz is below threshold (−0.015, −0.025, −0.1 °C/m) |
| Temperature difference | First depth where T(z) is below T(ref) by a fixed amount (0.2, 0.5, 0.8 °C) |
The choice of method is not trivial. The difference 0.8°C method detects BLD in roughly 50% of the ocean; the gradient −0.015°C/m method detects it in only 24 to 35%. That is a factor of two in geographic coverage, and a factor of three in mean global BLD depth (from ~12.7 m to ~40.1 m). Temperature difference methods are more permissive: they detect BLD wherever there is any salinity structure above the thermocline, even without a clear thermal gradient.
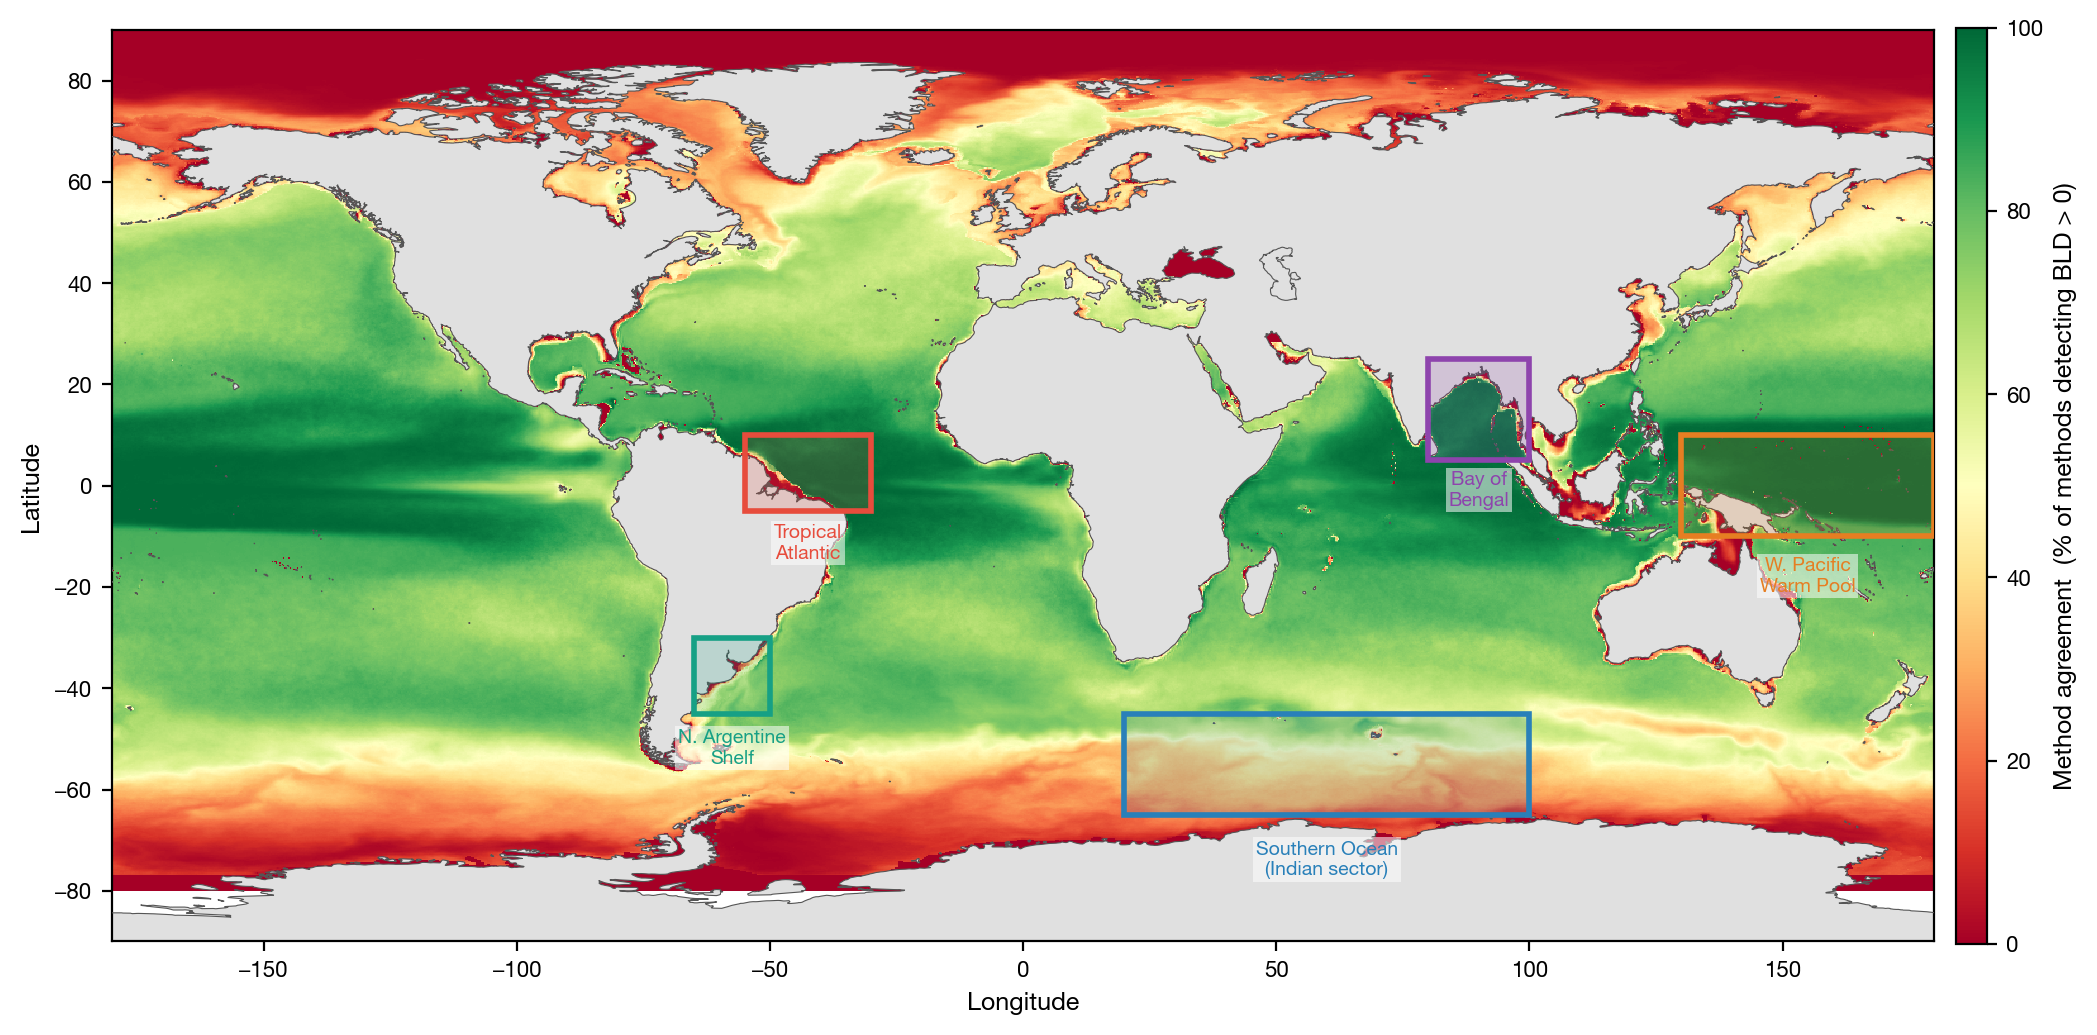
At each grid point and month, we compute the fraction of the six methods that detect a positive BLD. This inter-method agreement map is one of the core products of this analysis.
Key findings
Where barrier layers are robust. The western Pacific Warm Pool and Bay of Bengal show near-universal agreement across all six methods, with BLD regularly exceeding 50 to 80 m in the Warm Pool. The signal is so strong that the choice of threshold does not matter. The tropical Indian Ocean also shows consistent signals across methods.
Where methods diverge. The tropical Atlantic and Southern Ocean are where methods disagree most. In the tropical Atlantic, salinity is the dominant driver: freshwater input from continental river discharge (notably the Amazon) depresses surface salinity and creates a purely salinity-driven barrier layer, but because the thermocline is weak, gradient methods often fail to detect it. In the Southern Ocean, MLD and ILD nearly coincide for most of the year, and in austral summer, some difference methods detect a shallow BLD that gradient methods do not, suggesting thin salinity stratification from ice melt or precipitation without a clear thermal gradient.
Trends (1993–2024). The ensemble trend map shows a coherent pattern: BLD is deepening in the Indo-Pacific warm pool, the northern tropical Atlantic, and the subtropical Indian Ocean (up to +7 m/decade in the western Pacific Warm Pool), while it is shoaling in the Southern Ocean (−4 to −8 m/decade), consistent with the deepening of the austral mixed layer under climate change. Critically, while the sign of the trends is robust across methods, the magnitude is not. In the tropical Atlantic and at the edges of the Warm Pool, the inter-method uncertainty in trend magnitude is ±4 to 6 m/decade, comparable to the signal itself. This has direct implications for comparing results across studies that use different detection thresholds.
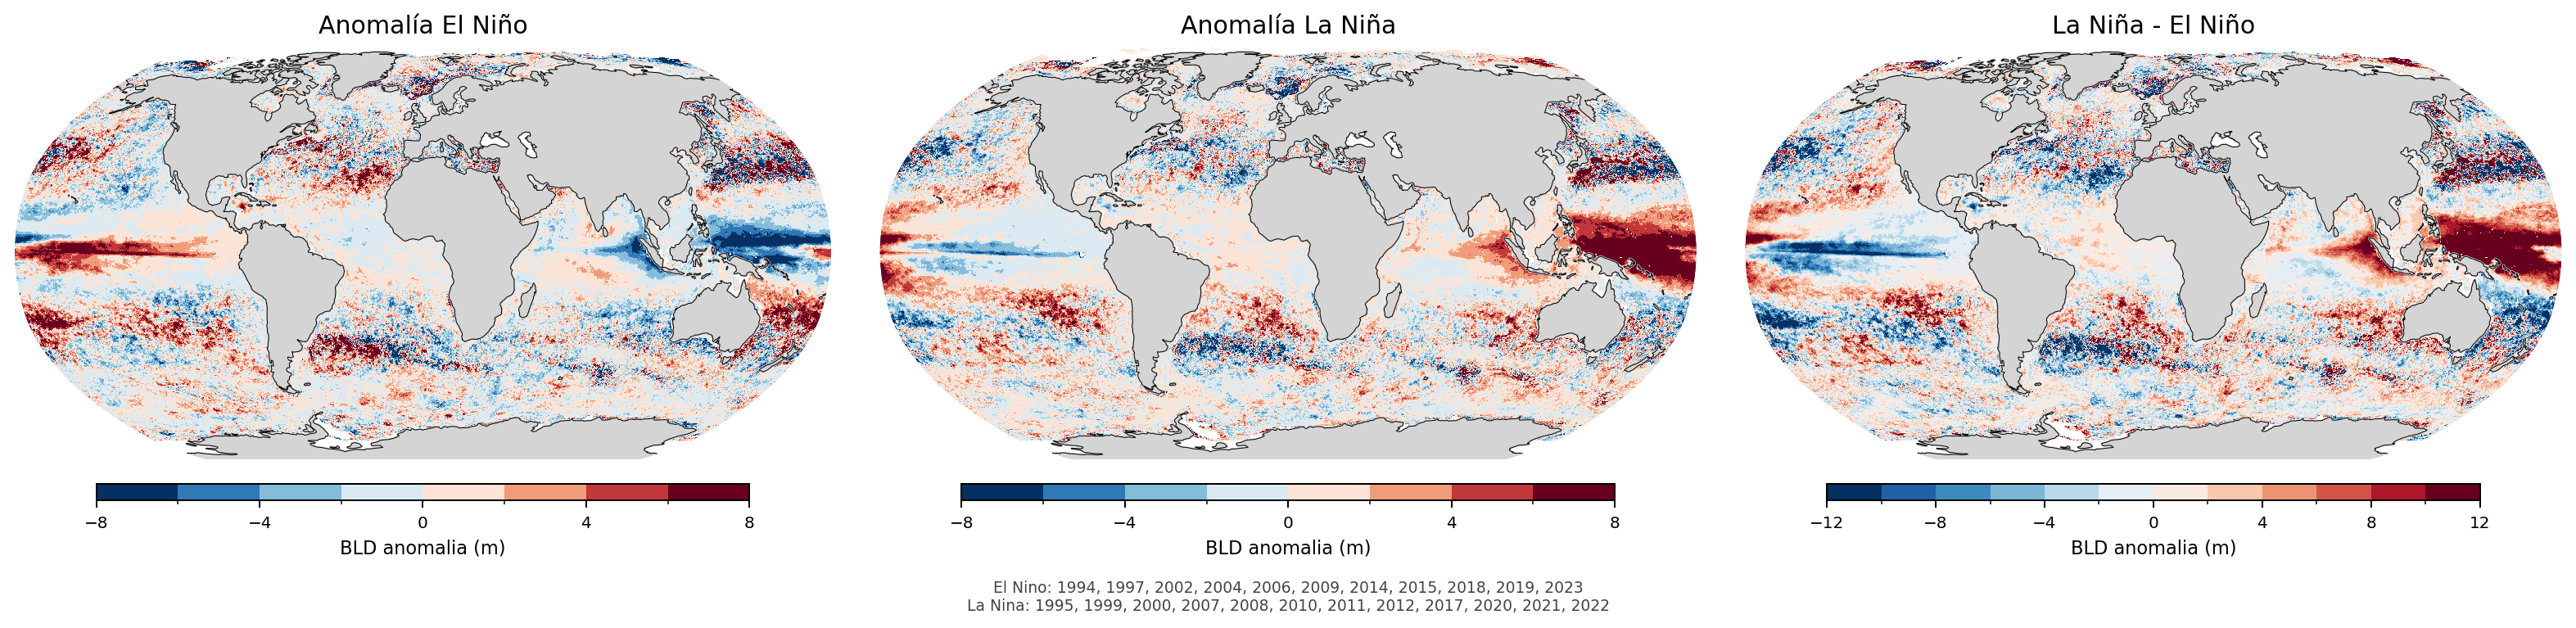
The ENSO signal. El Nino and La Nina leave a clear imprint on barrier layer depth. During El Nino, the ILD deepens in the central and eastern Pacific while the MLD shoals, thickening the barrier layer. La Nina reverses this pattern. The difference between composites reaches ±30 m in the western Pacific.
Data & code
- Data: CMEMS global ocean reanalysis, 0.25° and 0.083°, 1993–2024
- Code: Python (xarray, zarr, dask, numpy, matplotlib)
- Manuscript in preparation.